Financial Dashboard
OVERVIEW
Any company, regardless of size or complexity, can benefit from a WebTechCFO Financial Dashboard. By presenting a wide array of key financial, operational and statistical data in a concise format, you will have the ability to clearly view and understand complex relationships required for optimal business decisions.
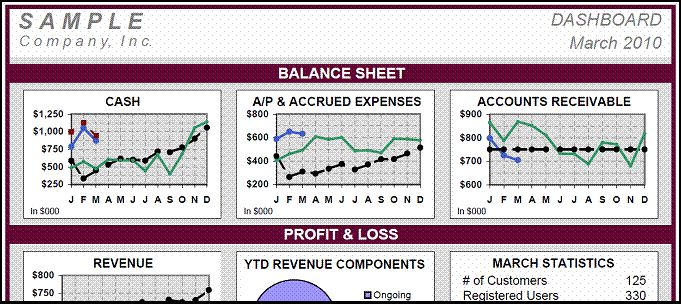
The WebTechCFO Dashboard is a customized combination of charts, tables, graphs and commentary designed to highlight trends in your company as they are developing, when there is still time to adjust your operations to maximize performance.
The WebTechCFO Team works with your management team to identify Key Performance Indicators (KPIs) representing all aspects of the company’s existence and then creates a Dashboard to specifically address your unique requirements and business model.
The KPIs can include any combination of data from the Balance Sheet, Income Statement, Cash Flow Statement, Headcount, Financial Ratios, Operational Statistics, etc.
HOW IT WORKS
WebTechCFO specializes in customizing a dashboard that works for you. We start with an initial consultation to understand your business model and identify the KPIs relevant to your company right now. Then we custom-build a dashboard that is reviewed monthly with the business owner to discuss potential drivers of developing trends. In addition, WebTechCFO schedules quarterly reviews with you and other key employees to discuss recent performance and near-term expectations, and how to incorporate this knowledge into results.
WHY IT WORKS
Dashboards are a proven tool that effectively highlights developing trends and simplifies complex relationships to help you understand your current position. WebTechCFO’s extensive business experience amplifies the effectiveness to provide you with a comprehensive interpretation and commentary for current KPIs and the flexibility to adjust the metrics as your company evolves and prospers.
 Connect with us online!
 Our Newsletter